According to database company Dealogic, global IPO volume in 2013 totaled US$173.3 billion via 934 deals, up 39% on 2012 (US$124.3 billion, 821 deals) and represented the highest volume since 2010 (US$281.4 billion).
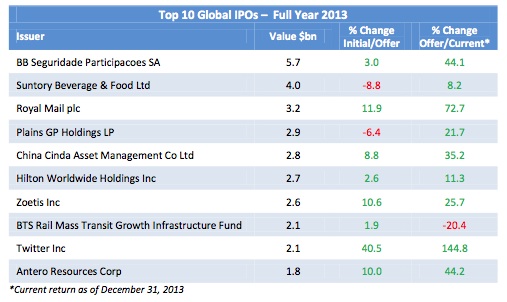
Last year, however, remained a year dominated by follow-on equity capital markets (ECM) transactions. The largest ECM deal of 2013 was a US$9.9 billion equivalent rights issue (and rump offer) for Barclays, while there were only two IPOs (BB Seguridade Participacoes in Brazil for US$5.7 billion, and Suntory Beverage for US$US$4.0 billion in Japan) in the top 10 deals as ranked by offer size.
38 IPOs for an amount of US$1 billion or greater priced last year for combined proceeds of US$64.7 billion, up from 17 such deals in 2012. Last year also accounted for the highest US$1 billion-plus IPO activity since 2007 (54 deals).
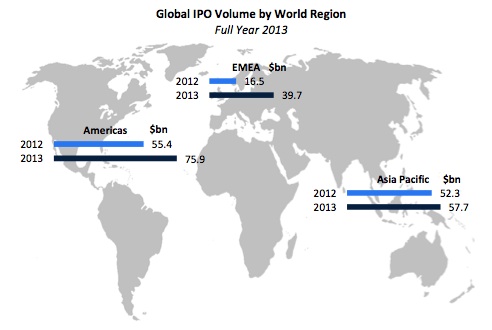
IPOs in the EMEA region raised US$39.7 billion (207 deals), more than double the 2012 volume of US$16.5 billion (153 deals). In the Americas, IPOs raised US$75.9 billion, up 37% on 2012 (US$55.4 billion, 203 deals), also the highest volume since 2007 (US$99.4 billion). The Asia Pacific IPO volume increased 10% to US$57.7 billion in 2013.

For the first time on record, real estate led the IPO industry sector ranking, with US$28.0 billion raised through 103 deals in 2013 and accounted for 16% of the global IPO volume, the highest share on record. REIT IPOs accounted for 79% of volume and 71% of activity (US$22.1 billion via 73 IPOs).
Financial sponsor-lead IPOs stood at a record high: US$57.8 billion. In the EMEA region, these IPOs represented 46% of the total IPO volume (US$18.2 billion), the highest proportion on record. 44% of the volume raised was in the Americas (US$33.2 billion) and 11% in the Asia Pacific region (US$6.4 billion).
In 2013, IPOs averaged a 26% one-month return globally, up from 14% in 2012. IPOs in the technology sector enjoyed a one-month average performance of 59%, the highest percentage since 2000 (67%). Twitter’s US$2.1 billion IPO was the largest technology and internet-related IPO of the year and the second largest US internet-related IPO on record behind Facebook’s US$16.0 billion IPO in 2012. Twitter returned 73% after one month of trading compared to a one month drop of 21% for Facebook.

The US exchanges recorded the highest number of IPO listings (230) since 2007 (288 deals). For the first time since 2007, more IPOs listed on the Nasdaq (114 deals) than on the NYSE (111 deals).
IPO revenue for investment banks totaled US$5.7 billion in 2013, up 46% from US$3.9 billion in 2012. In the Americas and EMEA, revenues were up 73% and 113% respectively, while the Asia Pacific recorded a decrease in IPO revenue of 7%.
